21 February 2008
CAIDA IPv6 Topology Maps

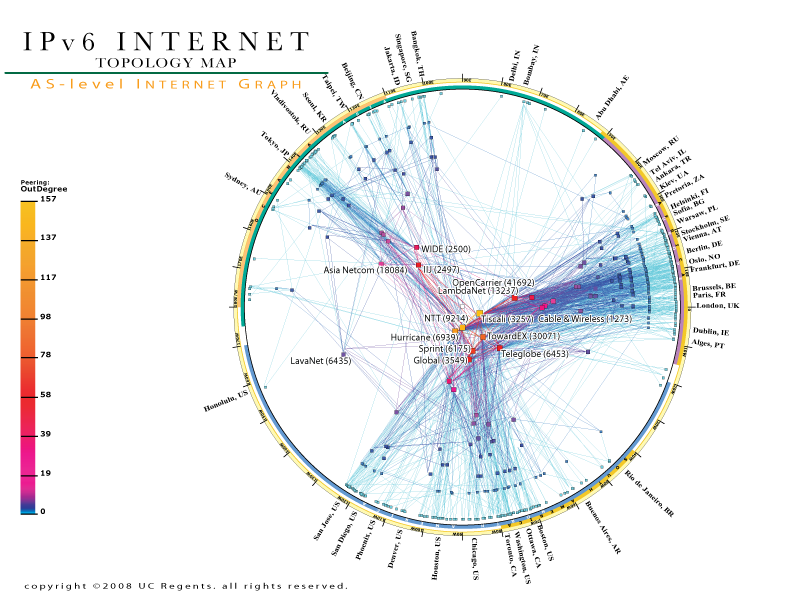
I was interested to see that CAIDA had released an updated IPv6 topology map based on statistics gathered in January 2008. The graphs are a visualisation of ASs (Autonomous Systems) in the Internet based on the number of routes between them. ASs are usually controlled by a single owner, and thus this diagram tries to capture logical complexity of the network of networks that is the Internet.
These graphs create an interesting picture of the complexity of the Internet. For comparison have a look at the IPv4 topology map (multiple versions). If you look at these you'll see that the current IPv6 topology is as complex as the IPv4 Internet in 2000, at the height of the dot com boom. Of course the current IPv4 topology is more complex (latest shown currently is 2007).
Ever since I discovered these graphs I have thought that they were a great way to visualise the complexity of the Internet (IPv4 and IPv6).